Analyzing UHF signals using FFT programs.
Spectrum analysis of beacon signals is a very powerful tool. By investigating
the frequency domain of a signal, it's possible to see features relating to
various propagation phenomonen.
It's not necessary to have a dedicated spectrum analyzer, instead a PC
can be used for recording, analyzing and displaying the audio signal from an
SSB receiver. The SSB receiver simply downconverting the RF spectrum to an
AF spectrum.
You will need an FFT program to calculate the frequency spectrum from the (time domain)
signals in the sound card. Many different programs can be found on the internet.
I use one from
AF9Y.
Ordinary FFT display
Display of the 432 MHz beacon DF0AAD. Distance to the beacon is 195 km,
and with 10 W ERP it's always audible.
The picture shows audio frequency on the horizontal axis and time as the vertical
axis. The yellow line at 1250 Hz is the beacon signal.
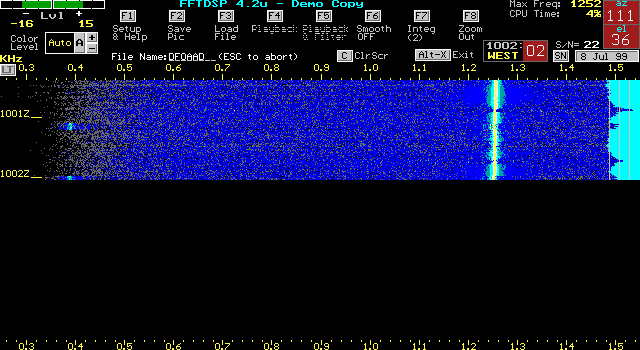
The two "burst" signals at 400 Hz is made when the beacon is transmitting ID using FSK modulated CW. To the right is three verical lines indicating S/N ratio in 100 Hz BW. Each line represent 10 dB, so the beacon is in average 30 dB, but with QSB.
432 MHz signal at/below the noise level
The display shows the 432 MHz beacon DL0UH. At a distance of 530 km and just 1 W ERP this beacon is only occasional audible at my location.
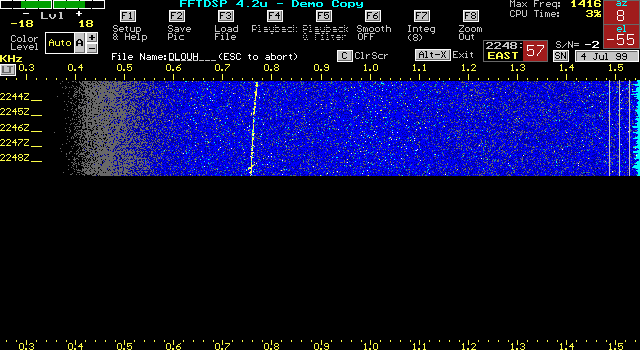
However by letting the PC integrate a high number of FFT samples (here 8) for each line displayed, the background noise can be cancelled making the beacon signal visible. This will of course increase the "detection" time.
10 GHz signal below the noise
The display shows the 10 GHz beacon DB0VC. This beacon is 195 km away. At the time of recording the beacon was not audible. However by plotting the frequency spectrum - line after line - the eyes quickly catches a band of yellow dots across the screen.
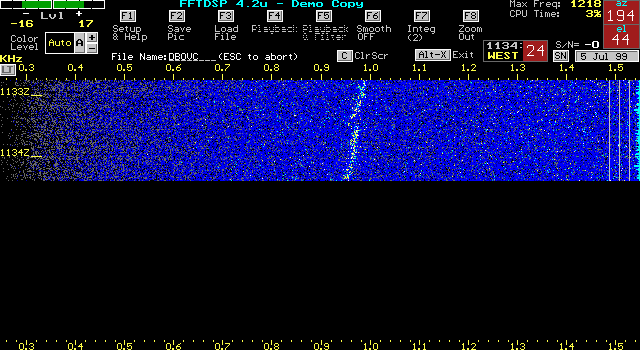
Note how the frequency is drifting downwards. This is due to temperature drift of the LO in my mastmounted transverter. (Need to build an oven!)
You may also note that the spectrum is 10-20 Hz wide. This is due to doppler spread and often seen on 10 GHz scatter signals. If audible the tone would have a "rough" note.
Reflections from airplanes
When investigating off-the-air spectrums from beacons, you often see more
than one signal. This can be other beacons (or receiver spuriouses), but
often it is the beacon signal reflected from airplanes.
The frequency of these signals will be doppler shifted - as a function of
the aircraft speed and direction relative to the TX - RX path. This makes
them easy to spot.
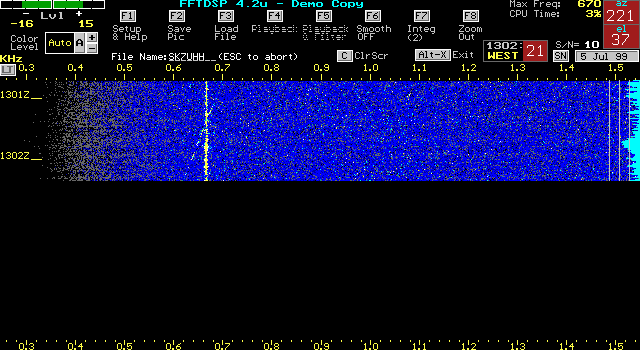
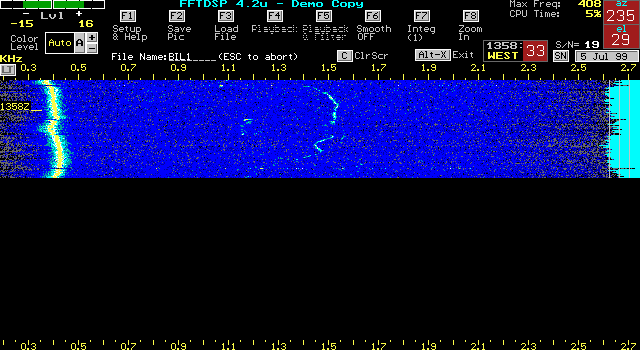
The SK7UHH beacon is 424 km away and running high power. On the spectrogram you see a line crossing the beacon frequency line - this is reflections from an aircraft. It's very typical to have these kind of sweeping frequency lines starting above and dropping below the beacon frequency.
The doppler shift is always high when an airplane enters the space between a transmitter and receiver. As the plane passes the direct RX - TX path, the doppler shift becomes 0 Hz and the reflected signal zero beats with the beacon signal - giving a wavering or fluttering signal at that time. When the airplane leaves the direct RX - TX path, the doppler shift becomes low and the reflected frequency drops below the beacon frequency.
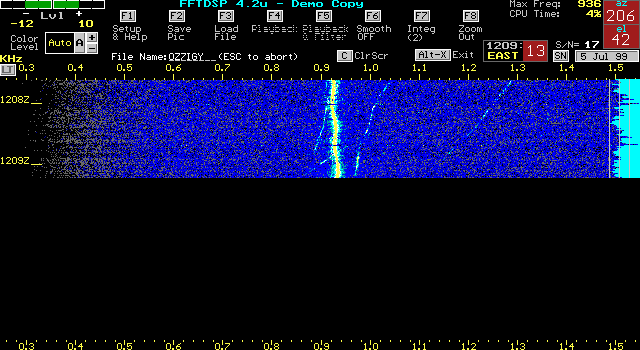
This picture shows the OZ7IGY beacon on 432 MHz 127 km away running 30 W ERP. Note the many doppler shifted reflections. (The spectrogram also shows frequency variation of the beacon).
As my beam direction to the beacon also lines up with the direction to the international airport of Copenhagen - some 170 km away - there are always a lot of reflections from airplanes passsing by or moving around in landing or take-off patterns.
Doppler radar
This is an example of my 10 GHz station used as a doppler radar. Just
as the police "speed radar".
I'm receiving the transmission from the OZ5SHF 10 GHz beacon abt. 8 km
to the north of me - seen here as a 400 Hz audio frequency on the spectrogram.
However my antenna is pointed to the south, where at a distance of 4 km
there is a small hill carrying one of the exit roads from the city of Horsens.
When cars are leaving the city and passing over the hill, they are in direct
view of the beacon and of my 10 GHz antenna.
The beacon is illuminating the "targets" and I'm receiving the reflections
from the cars.
The picture shows the reflected signal at 1500 Hz - shifted 1100 Hz upwards. As the car is driving directly towards me (and the beacon), the speed can be calculated to 61 km/h. (And the speed limit on this piece of road is 50 km/h!)
Back to OZ2OE homepage.